Teaching Statistics Investigations > Chapter 4

Teaching Statistics Investigations Chapter 4-Using Multivariate Data to Investigate Fuel Economy in Vehicles
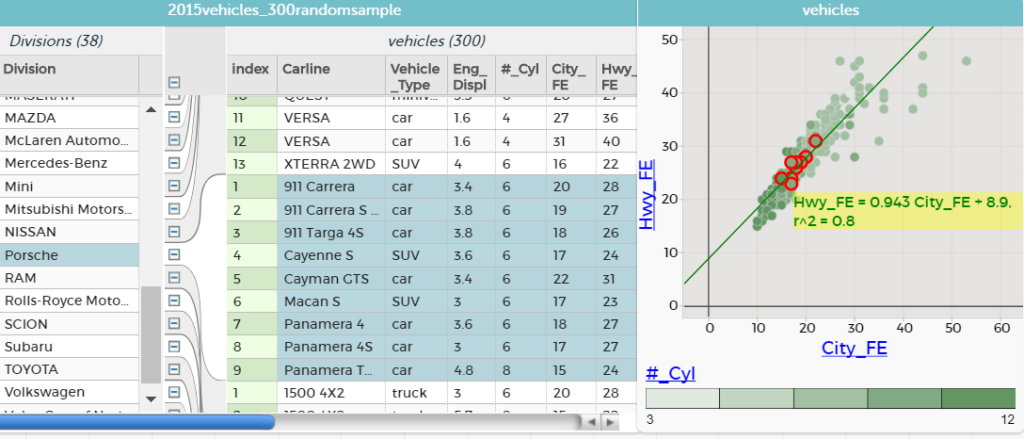
Teachers use CODAP to investigate driving fuel economy using a random sample of 300 vehicles manufactured in 2015 that includes many different attributes such a fuel efficiency in the City and Highway, annual fuel costs, whether the vehicle is a hybrid, the transmission type, and vehicle type. This multivariate data set in CODAP allows for investigating questions concerning subgroups of data and bivariate relationships. Teachers learn key ways to display and analyze data using tables, graphs, and computed measures, and consider pedagogical issues concerning students’ learning and instructional choices. The chapter materials include 3 sections, with separate PDFs, assignments and readings (PDF), and a CODAP file that can be downloaded or accessed directly online.

Class Materials
| This links to a CODAP online document that contains the random sample of 300 vehicles manufactured in 2015 used in this chapter. Teachers need access to this document to complete chapter activities. | Investigate Data in CODAP |
| Context, Question Posing, & Early Exploration: Teachers analyze a large multivariate data set about vehicle fuel economy using CODAP. They will pose questions and engage in exploratory data analysis using tables and graphs to notice interesting aspects of the vehicles in the sample. They will consider pedagogical issues related to the use of context, different ways of representing data in tables and graphs, and benefits or drawbacks to exploratory analysis. | Section 1 |
| Investigating the Aggregate and Comparing Subgroups: Teachers use CODAP tables, graphs, and measures to investigate questions that involve making sense of the sample data in the aggregate using center and spread of a distribution. Teachers also take advantage of other variables in the data to compare subgroups. They consider different pedagogical issues that can impact students’ learning. | Section 2 |
Investigating and Modeling Bivariate Data Teachers use CODAP tables and graphs to continue to analyze automobile data for describing relationships in bivariate data and developing a linear model for making predictions. The concept of variation and deviations from the mean is used to help understand least squares regression and residuals. Teachers consider difficulties students may have in analyzing bivariate relationships when given access to multivariate data. | Section 3 |
This video is part of the Voices From the Field video collection. The video case gives an opportunity to consider how a teacher sequences students’ work and asks questions to encourage students to explain and justify their work. This video is an animated depiction of actual students’ work on the vehicle fuel economy data investigation. | Video Case: Orchestrating a Productive Discussion from a Data Investigation |
| This video shows a lesson in a high school mathematics classroom where students engaged in a statistics lesson centered around investigating the 2015 vehicle fuel economy data along with the teachers’ reflections on how the use of CODAP impacted students’ learning and suggestions for pedagogical approaches when using CODAP. | Video Case: Statistics Teaching with CODAP |
| Suggested homework tasks and supplemental readings | Assignments & Readings |
