Teaching Statistics Investigations > Chapter 2

Teaching Statistics Investigations Chapter 2-Students’ Reasoning About Comparing Distributions
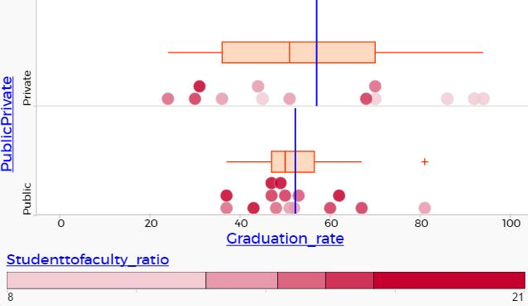
Teachers engage in a task to compare graduation rates among a sample of private and public colleges in NC, and anticipate how middle school students might think about the problem with the software. Teachers then view a video case of teachers and students working with TinkerPlots on the task, and analyze students’ work and interactions with the software. The purpose of this extensive case is to have teachers critically examine the ways students use features of a technology tool to examine data and then consider implications for teaching specific to this case, as well as general ideas for engaging students in multi-variate data sets with dynamic graphing tools.

Class Materials
This links to a CODAP online document that contains the state educational data used in this chapter. Teachers need access to this document to complete chapter activities. | Investigate Data in CODAP |
| Investigate Graduation Rates: Teachers engage in a task comparing distributions using CODAP and anticipate how middle school students might think about the problem. | Section 1 |
| Examine Students’s Work: Teachers view a video case (below) of students working with TinkerPlots on the comparing distributions task, and analyze students’ work and interactions with the software. There is also an optional transcript of the conversation. | Section 2 |
| Suggested homework tasks and supplemental readings | Assignments & Readings |
