Teaching Statistics Investigations > Chapter 1

Teaching Statistics Investigations Chapter 1-Center, Spread, and Comparing Distributions
Teachers engage in exploratory data analysis to examine national school expenditure data using CODAP and consider how the use of a technology tool affects the teaching and learning of data analysis techniques. They also compare distributions using the same data set. Finally, teachers explore measures of center using interactive applets and consider how the technology affects students’ learning.

Class Materials
This links to a CODAP online document that contains the state educational data used in this chapter. Teachers need access to this document to complete chapter activities. |  Investigate Data in CODAP |
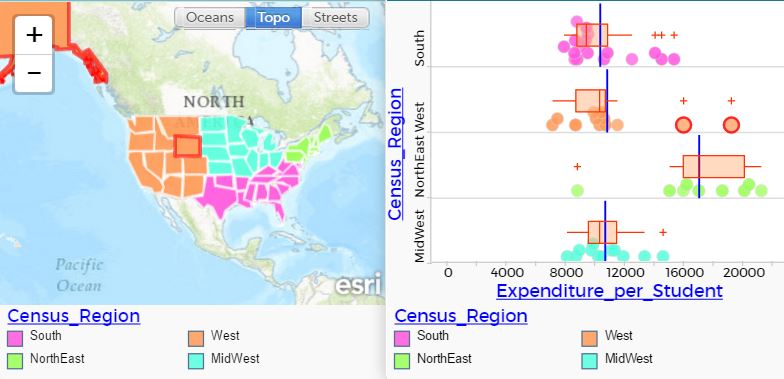
| Center and Spread: Teachers engage in exploratory data analysis to examine national school expenditure data using CODAP to create graphical displays of qualitative and quantitative data and explore measures of center and spread. Teachers consider how the use of a technology tool affects teaching and learning of data analysis techniques. | Section 1 |
| Comparing Distributions: Teachers engage in exploratory data analysis to compare sets of data. Teachers consider how the use of a technology tool affects the teaching and learning of data analysis techniques. | Section 2 |
| Delving Deeper into Measures of Center Using Applets: Teachers explore measures of center using interactive applets and consider how the technology affects students’ learning. Applet 1, Applet 2, Applet 3. | Section 3 |
| Suggested homework tasks and supplemental readings | Assignments & Readings |
